By Madhu Murali
Our monitoring work at industrial and municipal wastewater treatment plants has found that they have a significant potential for heat recovery. However, there are some concerns regarding the impacts of heat recovery on the efficiency of treatment processes, particularly if a heat exchanger is introduced into the treatment area. To assess these potential impacts, we have replicated a common industrial treatment process, Dissolved Air Flotation, in the lab-scale at Trinity College Dublin. This setup will be used to both determine the scope for heat recovery from Dissolved Air Flotation Tanks and assess any subsequent impacts on their treatment efficiency.
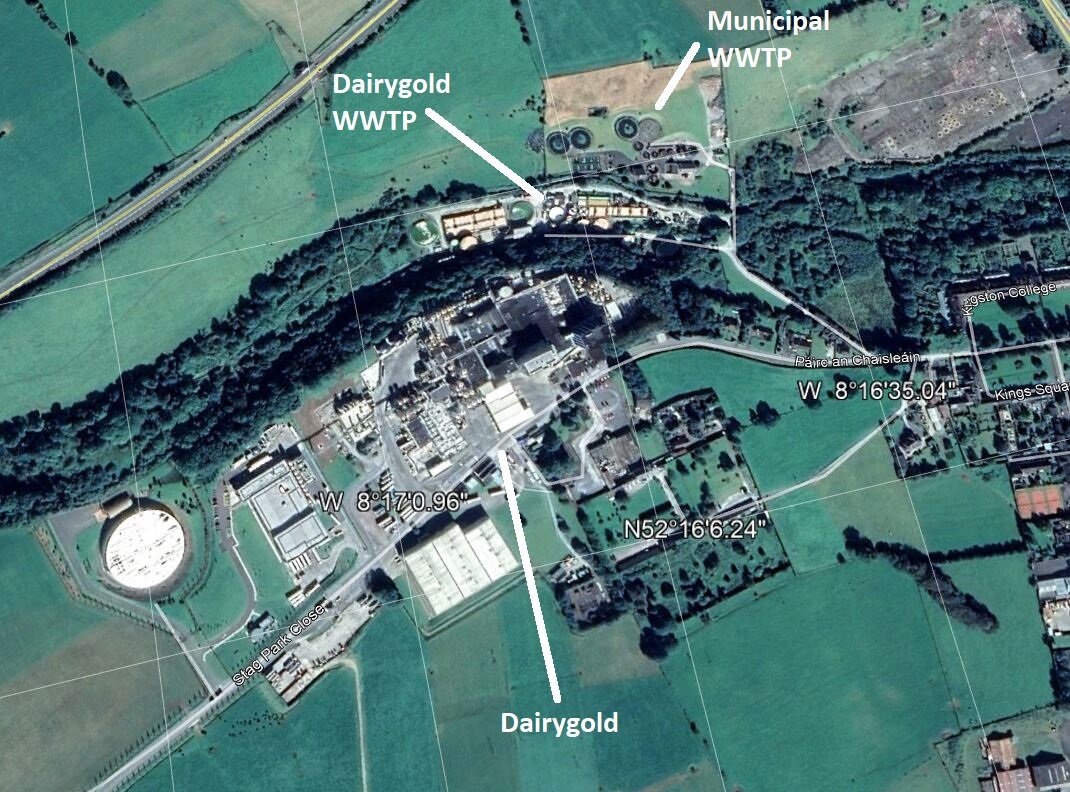
Wastewater temperatures at industrial sites can be very high, particularly in the food and beverage industries where cleaning with high temperature water is often required. Our monitoring work at two meat processing plants showed that their peak wastewater temperatures were as high as 40°C with an average temperature of around 20-30°C. As the wastewater from these plants are treated on-site in treatment facilities, there is an opportunity to recover some of the embedded heat in the wastewater while it is treated. However, the potential negative impacts of heat recovery on the treatment efficiency of wastewater treatment processes should also be analysed to ensure they are minimal. A common treatment processes present in both on-site treatment facilities, Dissolved Air Flotation (DAF), has been selected to conduct a detailed analysis to determine the impacts of heat recovery on its operational efficiency.

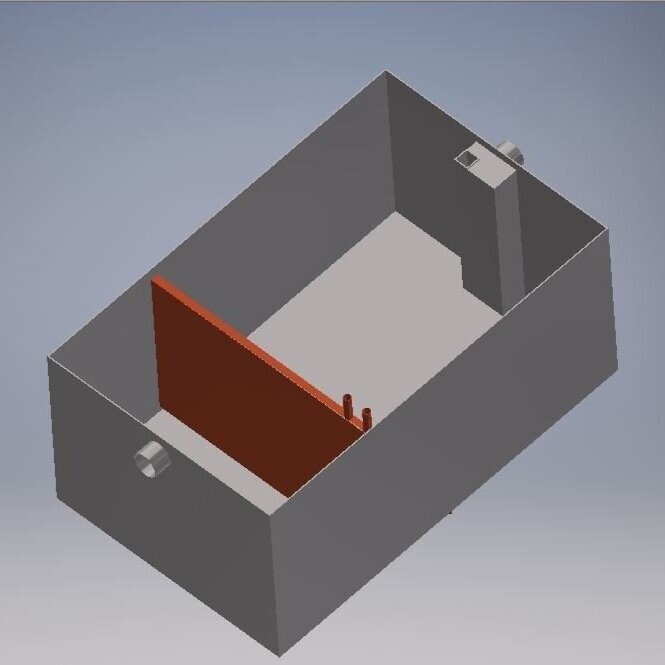
Figure 1: A schematic diagram of the lab-scale dissolved air flotation tank
DAF is a physical treatment process by which suspended pollutants in water can be removed. Small bubbles (or microbubbles) are introduced into the wastewater in a DAF Tank, the bubbles aggregate around suspended particles in the water and lift them to the top of the tank where they can be skimmed off the surface. The microbubbles are formed by compressing air and water in a tank or vessel, called a pressure vessel, to a high enough pressure that the water is saturated with air. When this pressurised air and water mixture is released into the DAF tank through special valves that maintain pressure, the rapid change in pressure from the pressure vessel to atmospheric pressure causes the air to be released in the form of microbubbles. Flow patterns within the tank are controlled by the use of baffles, positioning of the inflow/outflow, and the volume of inflows such that the removal of suspended particles is improved. DAF is commonly used to treat wastewater from the meat processing industry, which have a lot of organic and suspended pollutants in them.

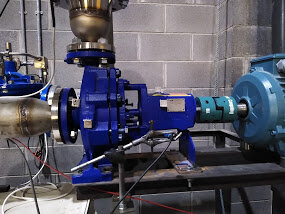
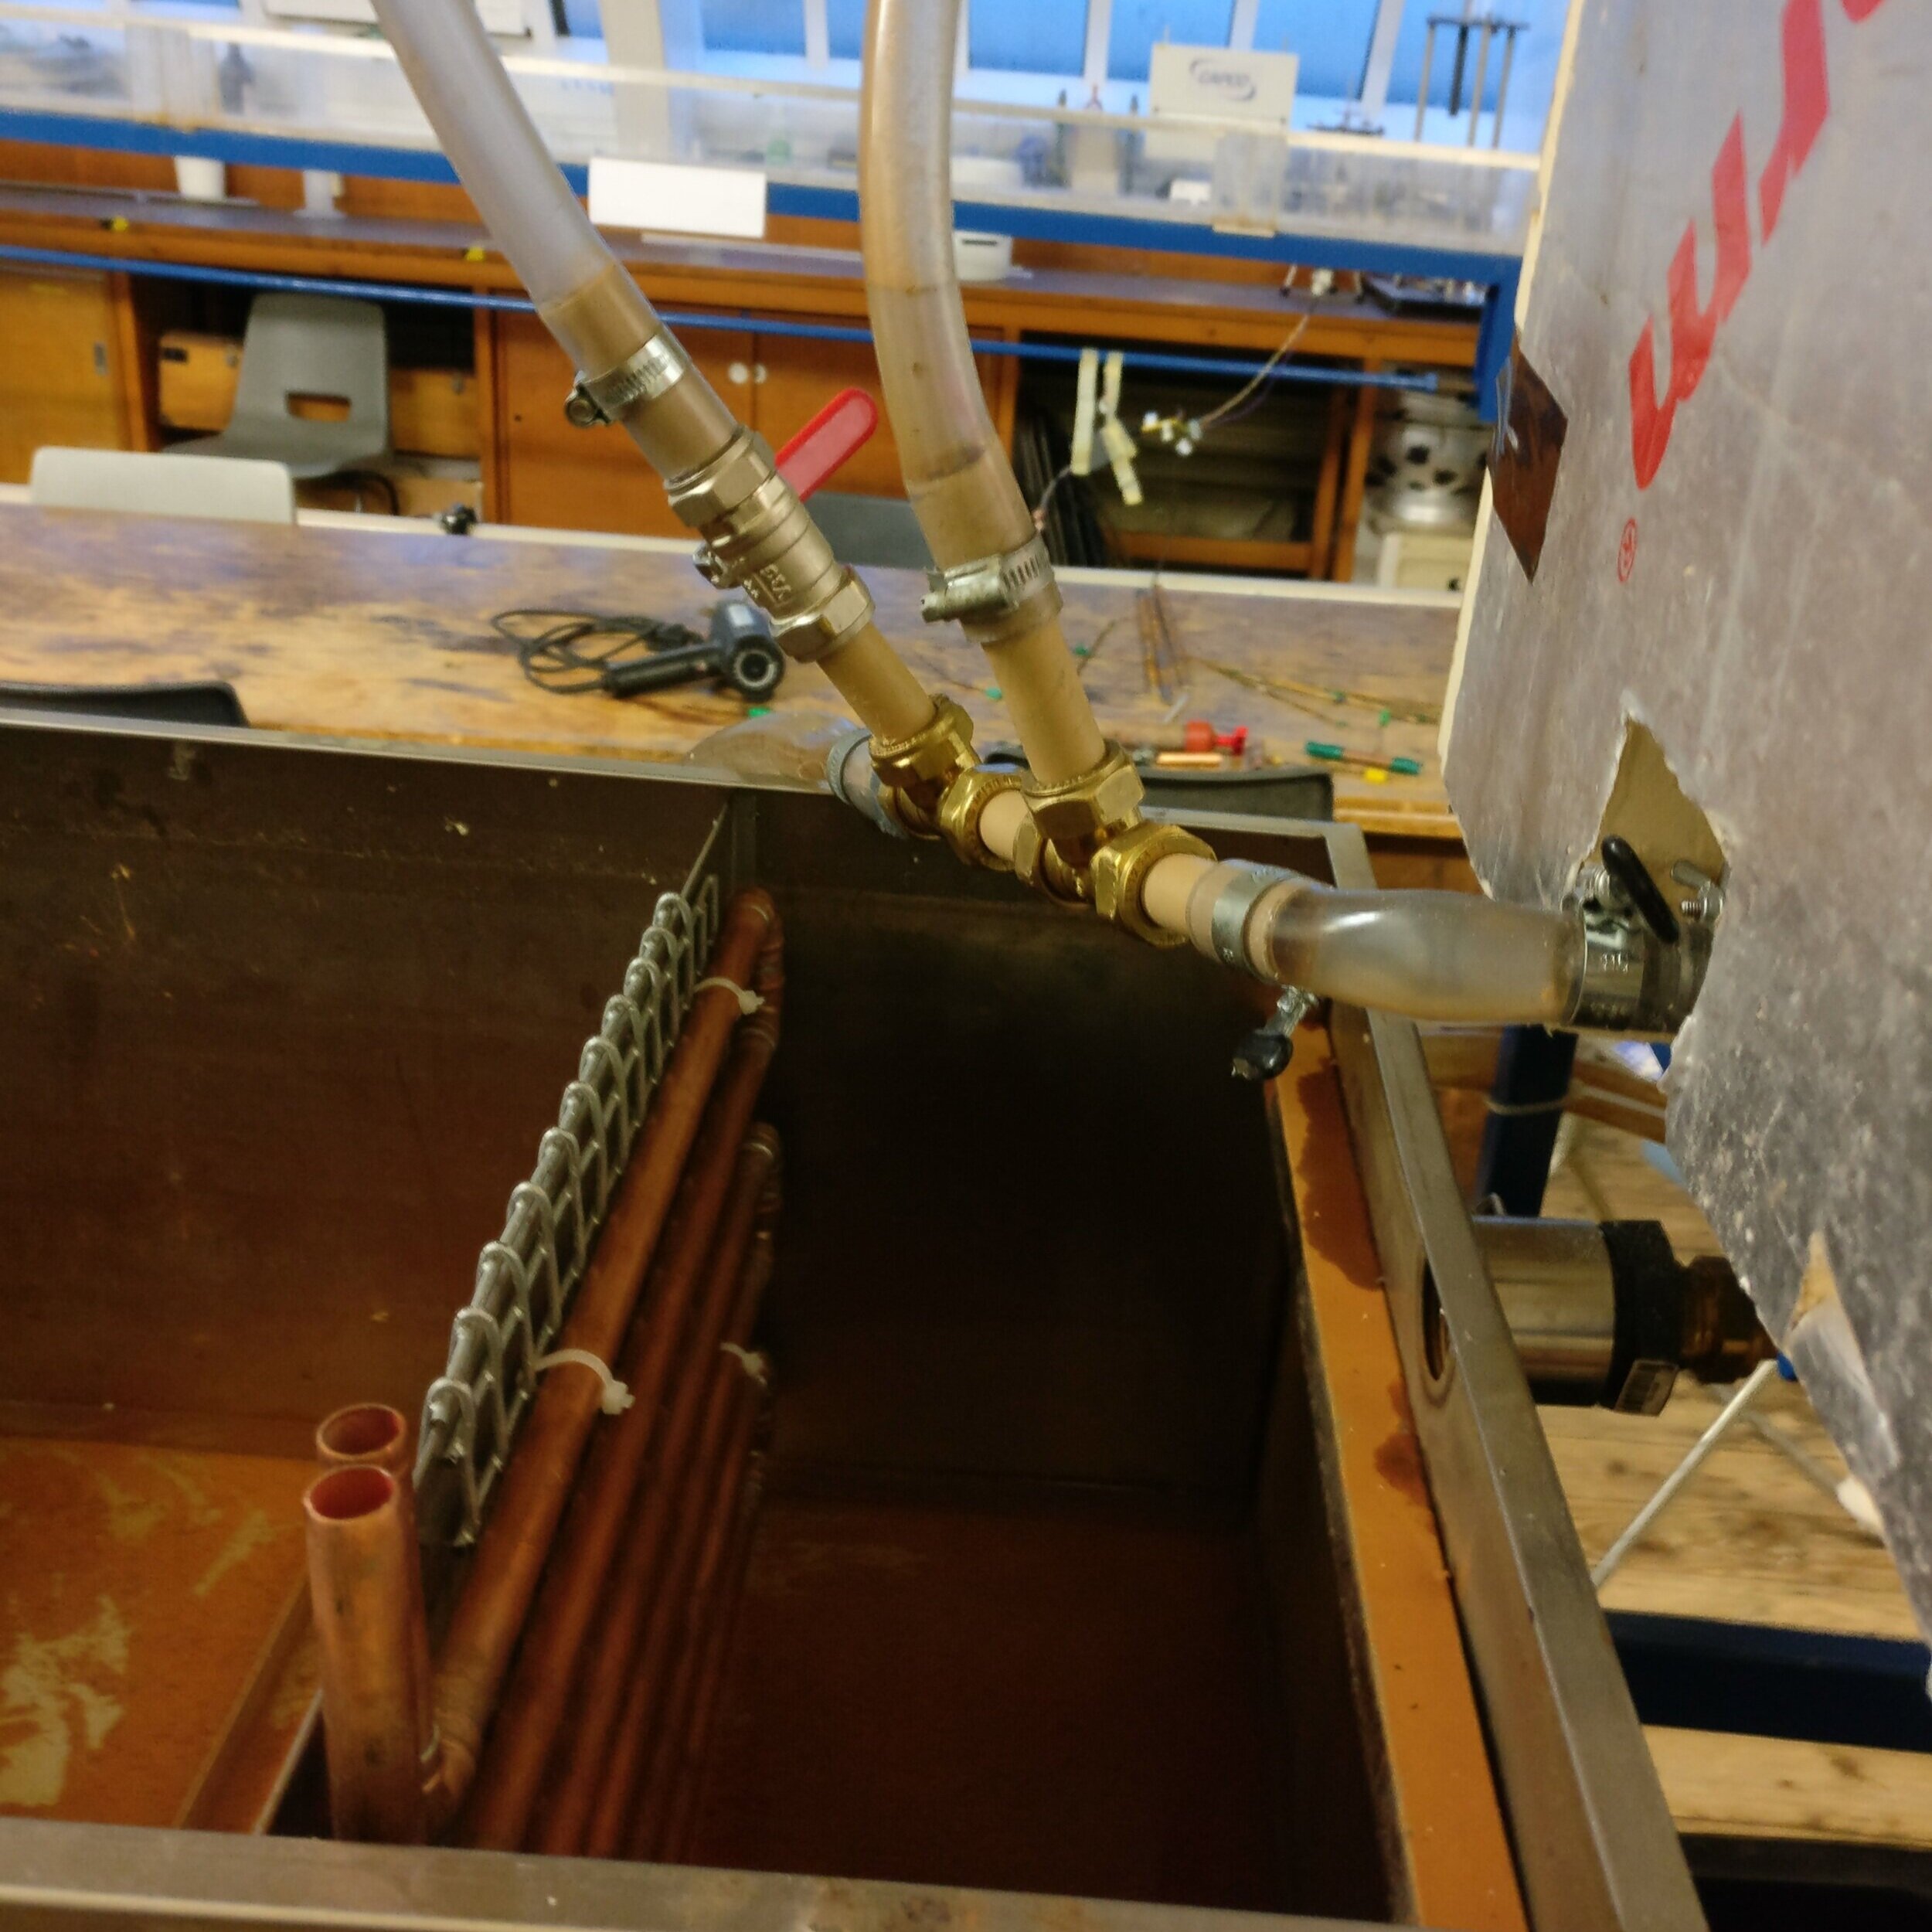
Figure 2: A photo of the lab-scale dissolved air flotation tank with microbubbles seen on the surface
A lab-scale DAF tank (Figures 1 and 2) has been set up at the Hydraulic Laboratory in Trinity College Dublin for experimentation related to heat recovery. The DAF tank is supplied heated water at a maximum temperature of 40°C from a supply tank and a pressure vessel supplies the water/air mixture to create microbubbles. The DAF tank also has two baffles near the inlet to control flow through the tank. Initially, the focus of our work with the lab-scale tank will be in identifying parameters to stably operate it and then characterising flow patterns in the separation zone of the tank to ensure that this is similar to that seen in other DAF tanks.
Future work will focus on identifying optimal locations for heat recovery in the DAF tank by measuring water temperature at different locations and identifying areas with optimal flow patterns. A heat exchanger can then be installed at a selected site to quantify the amount of heat recovery possible in our lab-scale tank. Another line of work will focus on determining any impacts on treatment efficiency in the DAF tank due to heat recovery.
This will involve examining the change in flow patterns and any significant changes in outlet wastewater temperature due to the introduction of the heat exchanger. A proxy suspended pollutant, such as clay, may also be used to determine if heat recovery impacts on its removal by the DAF tank.