
By Nathan Walker
Evaluating efficiency has many advantages to companies, such as enabling assessment of explanatory factors however, the process of doing so is not always easy. Sometimes missing data leads whoever is conducting the research to utilise proxy variables, which replace the ideal choices.
The explanatory factors* analysed in the study were: leakage, per capita consumption, number of sources, proportion of water through size 5-8 water treatment plants (the largest 50%) and average pumping head height. Leakage and number of abstraction sources were concurrent in their negative effect and significance across both the energy and economic assessments. These results were expected to an extent since for leakage the more water that is lost, the more water needs abstracting, treating and delivering, which all require energy and money. Although diversifying abstraction sources can be a positive attribute for companies to make their supply more resilient, it appears as though this is at the expense of a significantly increased energy consumption owing to more pumping being required through a larger network of piping. Average pumping head height displayed a significant negative effect for energy, whereas the variable proportion of water passing through the largest four treatment works was deemed to have a significant negative effect on economic efficiency. These exogenous factors, therefore, need to be corrected for in future benchmarking activities and have the potential to inform water companies about factors to prioritise in order to improve efficiency.
The proxies that were tested were population served for drinking water and length of water mains, which replaced the output volume of drinking water produced and the input of CAPEX, respectively. These were chosen as they are frequently used as proxies in the academic literature. We found that the proxy population served for drinking water can adequately replace the volume of water produced as an input variable (Figure 1) in efficiency benchmarking when leakage and per capita consumption ranges are minimal since companies stayed at the same rank and explanatory factors displayed the same significance. Conversely, length of water mains performed poorly when replacing CAPEX as an economic input (Figure 2), implying companies were on average 12.6% more efficient, resulting in 10 companies changing their rank compared to the original variable and causing some explanatory variables to differ in direction of influence and significance. Further research is recommended on the energy and economic efficiency of WoCs and WaSCs, considering a wide range of exogenous variables and careful selection of (proxy) indicators.
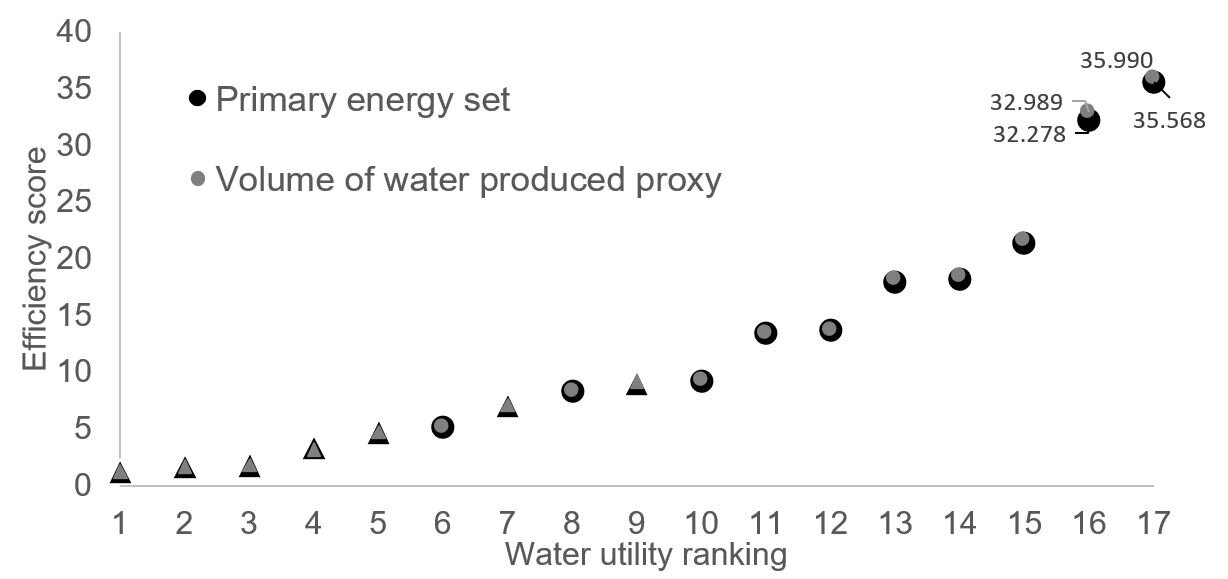
Figure 1. The energy efficiency results with the primary set of variables, and a volume of water produced proxy (population served for drinking water). WoCs are featured as triangles and WaSCs are displayed as circles. 1 Is the optimum efficiency rank and everything above that is classed as the degree to which companies are inefficient.

Figure 2. The economic efficiency results with the primary set of economic variables, and a capital expenditure (CAPEX) proxy (kilometres of water mains network). WoCs are featured as triangles and WaSCs are displayed as circles. 1 Is the optimum efficiency rank and everything above that is classed as the degree to which companies are inefficient.
The full research with more details on the background, methodology and discussion is available here: https://doi.org/10.1016/j.jenvman.2020.110810
*Only explanatory factor results that showed significant results are discussed here.