By Nathan Walker
Building on previous experience on performance analysis and love for efficiency, Dwr Uisce offered a perfect position for me, working primarily on benchmarking the water sector in Work Package 5. Throughout my time on the project, starting in 2017, colleagues and I have produced several research pieces, providing novel insights for water industry operators, benchmarking organisations, academia, energy efficiency analysts, regulators, and the wider public.
Early research focused on benchmarking the water sector in the UK and Ireland and making methodological and ideological advances, namely correcting for statistical bias, and incorporating more holistic sustainability frameworks. These studies showed that the sectors could on average reduce economic inputs by 19% and carbon outputs by 16% if they performed at the efficiency peak. Results further indicated the UK water sector has improved in productivity by 1.8% in recent years.

Figure 1. The energy intensity and associated greenhouse gas emissions for wastewater treatment.
The largest single piece of research I conducted was the international benchmarking exercise on wastewater treatment energy intensity, which covered 321 companies from 31 countries (Figure 1). Findings highlighted that EU states had the largest average kWh/m3 with 1.18, which appeared a result of higher wastewater effluent standards. Associated emissions were also calculated, and showed a clean electricity grid can affectively mitigate wastewater treatment inefficiencies, exemplified by Norway who emit just 0.013 kgCO2e /m3 treated, despite consuming 0.60 kWh/m3.
A particularly conceptually challenging research article I produced was around benchmarking sustainability performance across sectors. A methodology was developed to compare 18 companies across the water and sewage, energy, and communications sectors. This was based on 21 metrics covering service, environmental and economic data, and generated performance scores relative to sector peers. Results showed two distinct clusters, one of 7 sector leaders and the other of 11 lower performers. Sky had the highest score of 13.5 (max 15), significantly outperforming the communications sector. Similarly, British Gas and SSE lead the energy sector, whilst Wessex, Severn Trent, and United Utilities lead the way for water companies. Top performers can assess top performers in other sectors to identify how they can continue improving, whilst lower performers can look within and across sectors to identify best practices.
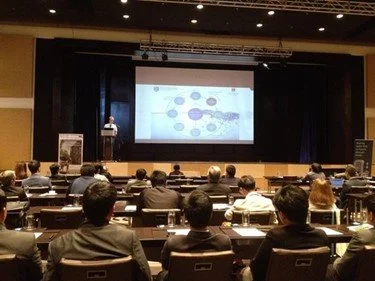
Figure 2. Nathan during his presentation at the 2019 IWA Efficient conference in Manila.
In addition to this research, I would like to emphasise the value that collaboration played on the research and related outputs. Whether it was via national and international conferences, project stakeholders, or colleagues, the quality and usefulness of research was undoubtedly enhanced.
Lastly, I would like to thank all my colleagues, both former and current, and our partners and supporters in Ireland, Wales, and the UK for making this project happen, and making the past few years so fulfilling and enjoyable.

Figure 3. From left to right, Richard, Prysor, Nathan, and Isabel enjoy a belated graduation day.